GCP Billing Analytics Dashboard
Cloud Cost Analytics Case Study
Summary
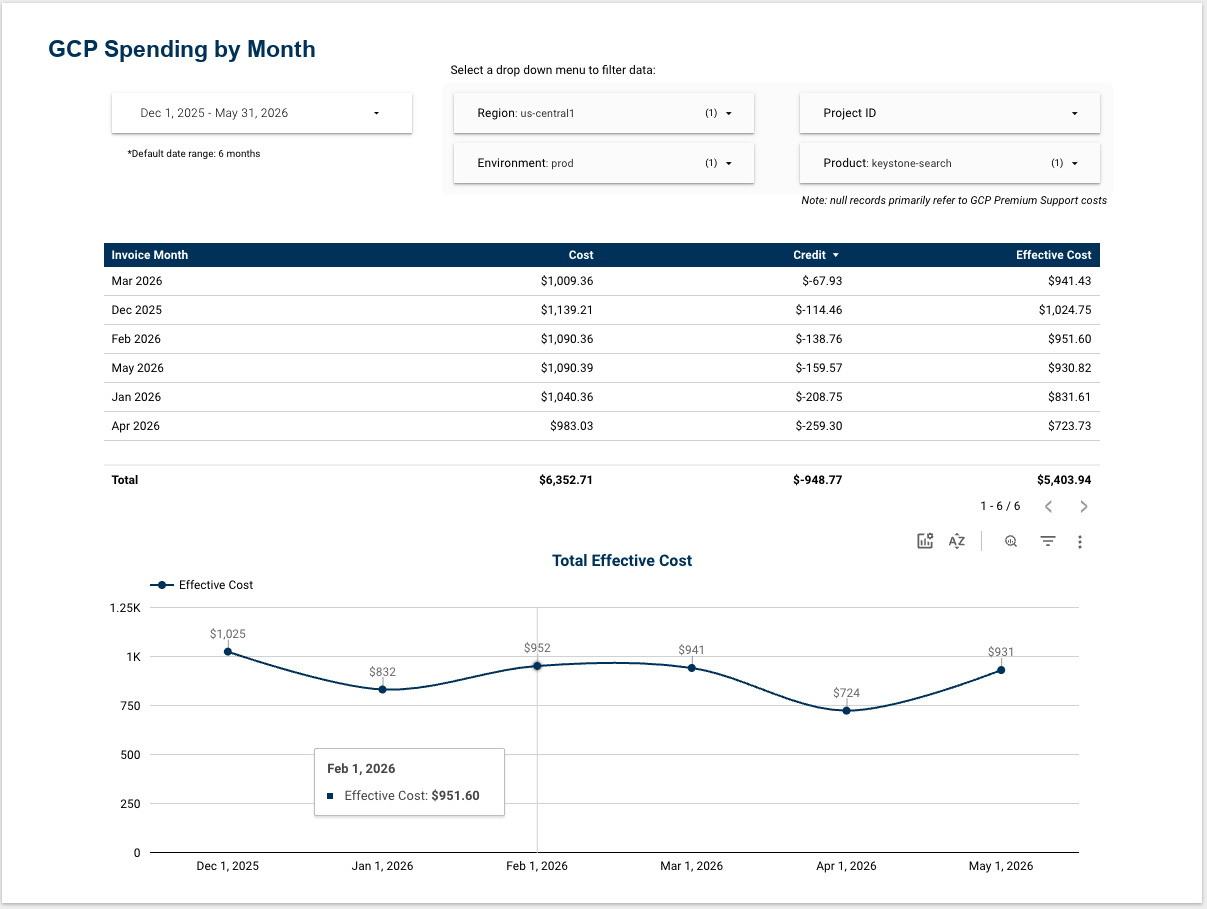
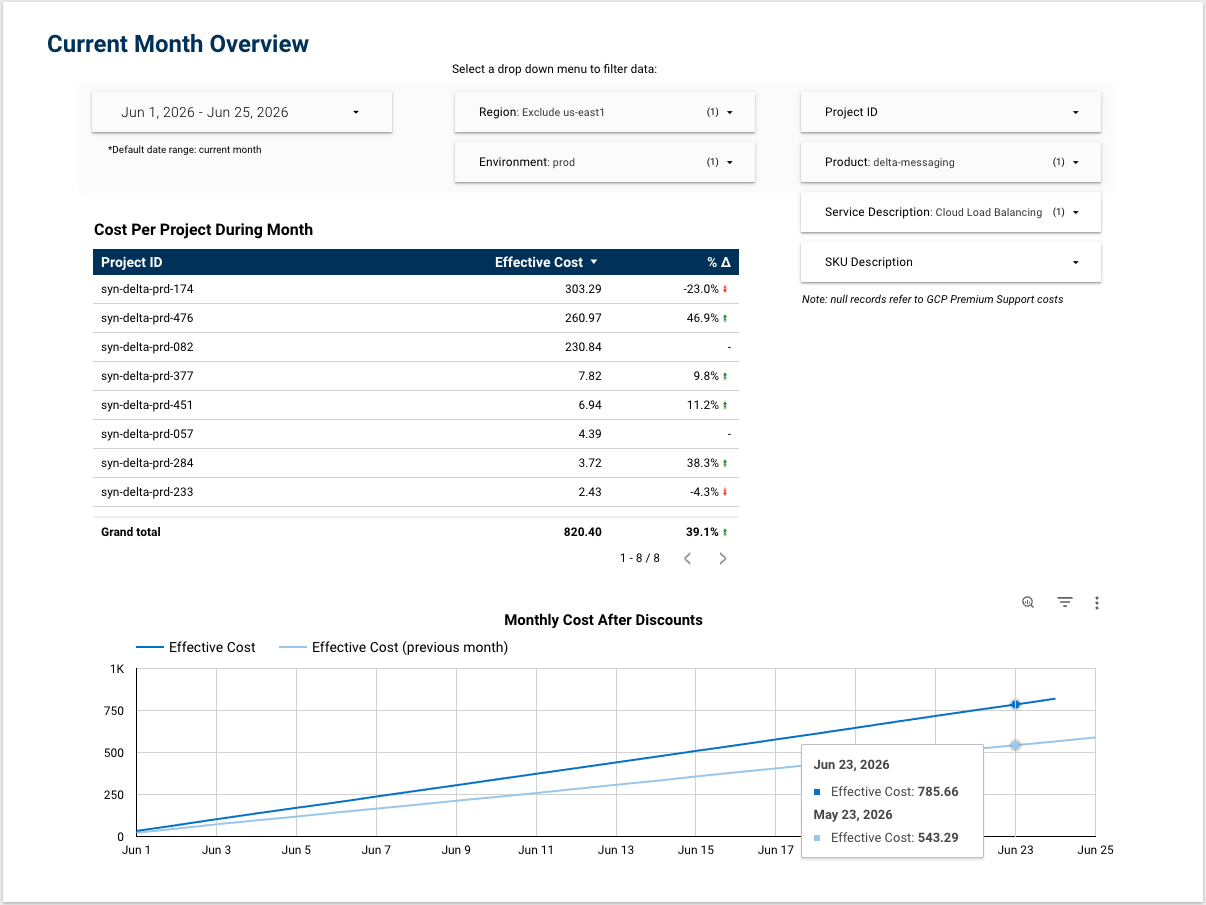
I rebuilt a real-world GCP billing reporting workflow as a portfolio-safe analytics project. The dashboards use synthetic cloud spend data in BigQuery to show monthly costs, trends, project-level spending, credits, and service/SKU detail.
The Problem
Engineering and product teams often need cloud cost visibility, but direct access to the billing account is usually limited to finance and cloud administrators. That creates a reporting gap: stakeholders need timely answers, not a dependency on cloud admins to generate one-off reports.
The Solution
I modeled billing export data into BigQuery tables and connected Data Studio dashboards that could be shared with the right audience. For this public version, the dataset is fully synthesized while preserving realistic cost patterns, project distribution, labels, credits, services, and SKUs.
The Stack
- BigQuery: Partitioned and clustered reporting table.
- GoogleSQL: Custom queries for monthly summaries, current-month views, time-series comparisons, and filtering.
- Synthetic Data Modeling: Generated realistic daily spend across projects, products, environments, regions, credits, services, SKUs, and cost centers.
- Privacy Controls: Used aggregate patterns only; all project names, owners, labels, costs, and report rows are synthetic.
- Data Studio: Dashboard pages for self-service cloud cost analysis.
Why It Matters
Cloud cost reporting is most useful when it is designed for the people making decisions. This project turns raw billing data into concise, shareable dashboards that help teams understand spend, spot changes, and reduce the reporting burden on finance and cloud administrators.